Analyzing monetization efficiency risk
Here we are going to examine the first lever of risk through the lens of the ad revenue business model. We will look at the monetization efficiency metric and the distribution of that metric over a period of time to understand one of the levers around revenue.
In a recent post I broke out the different levers of revenue risk. As a refresher here is the equation that shows all the levers:

In this post we’ll look the first lever (monetization efficiency) through the lens of an ad revenue based business. When looking at monetization efficiency, we need to look at eCPM. eCPM approximates the first lever for monetization efficiency.

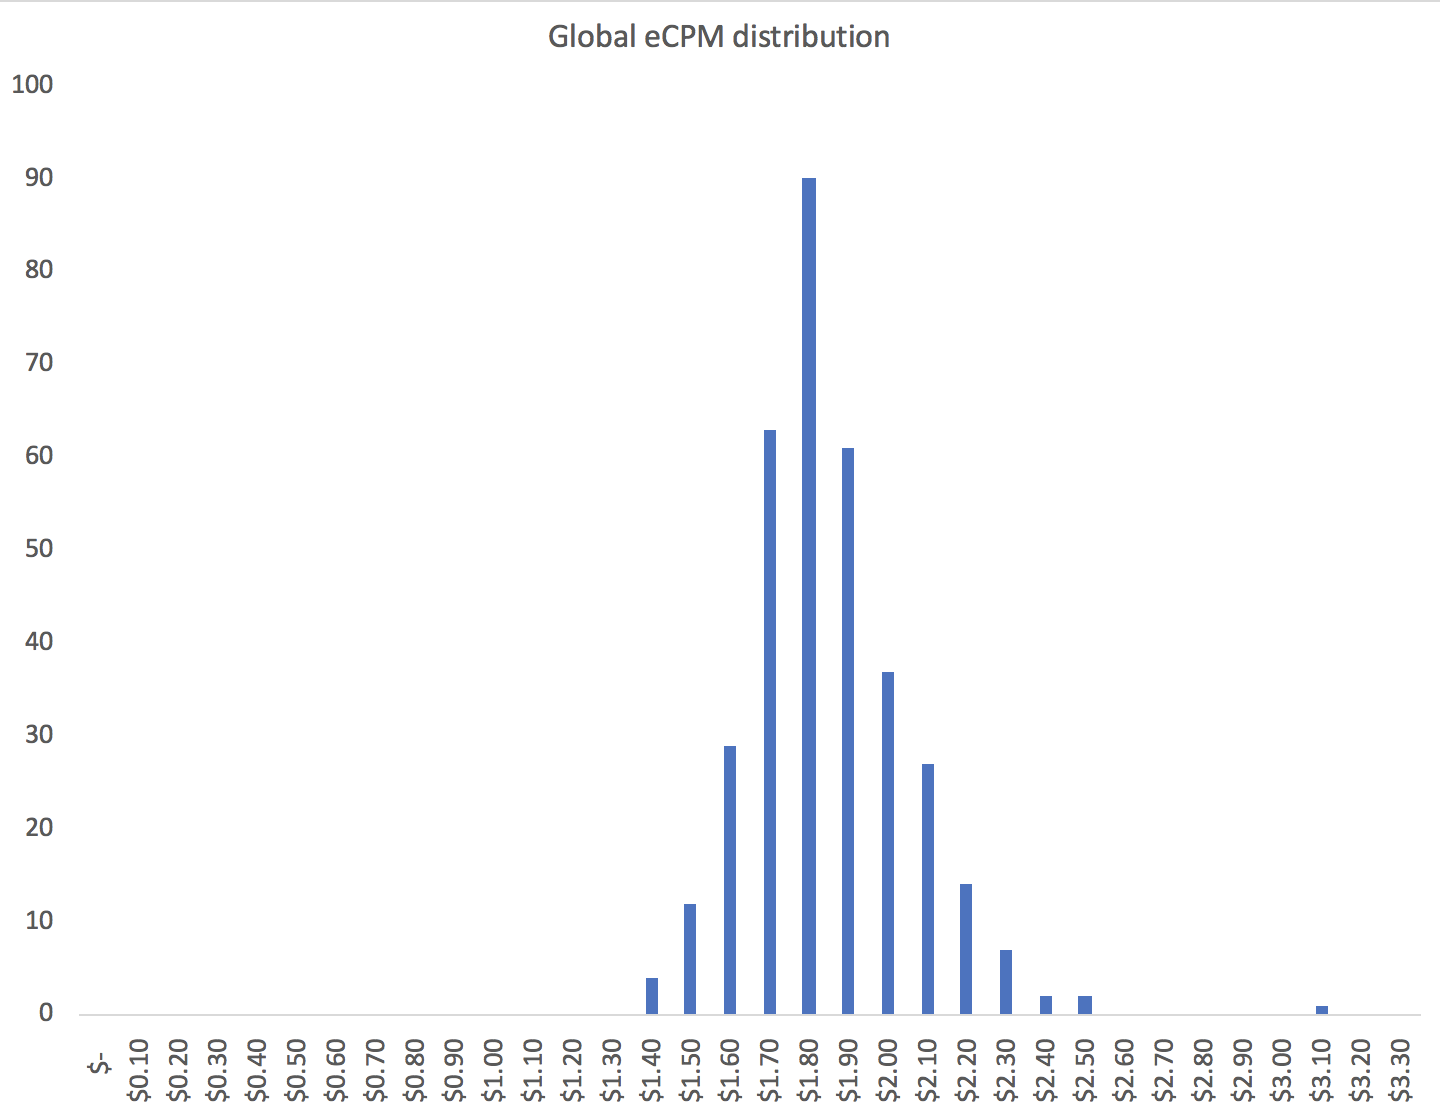
Looking at eCPM distribution, we get a sense of a business’ monetization efficiency and its predictability. Below is a sample dataset showing global eCPM values for the last year on mobile. Observing the spread (or standard deviation) of eCPM values can give insight into how a business might fail.

Looking at the histogram above, we can see that global businesses who use ad revenue as a monetization model expect eCPMs of around $1.70 - $1.90. With a standard deviation of $0.19, this shows a very tight spread of values; 68% of all businesses globally will fall into an eCPM lever of $1.60 and $2.00 for every 1000 impressions.
So why is this valuable?
- At face value this distribution allows you to compare your business’ performance to a generic ad revenue based business.
- It also allows you to make business decisions that may or may not add value.
Let’s say that your developers are building a mobile app for an ad revenue based business. In deciding which country to launch, you need to decide how each market will react through monetization.
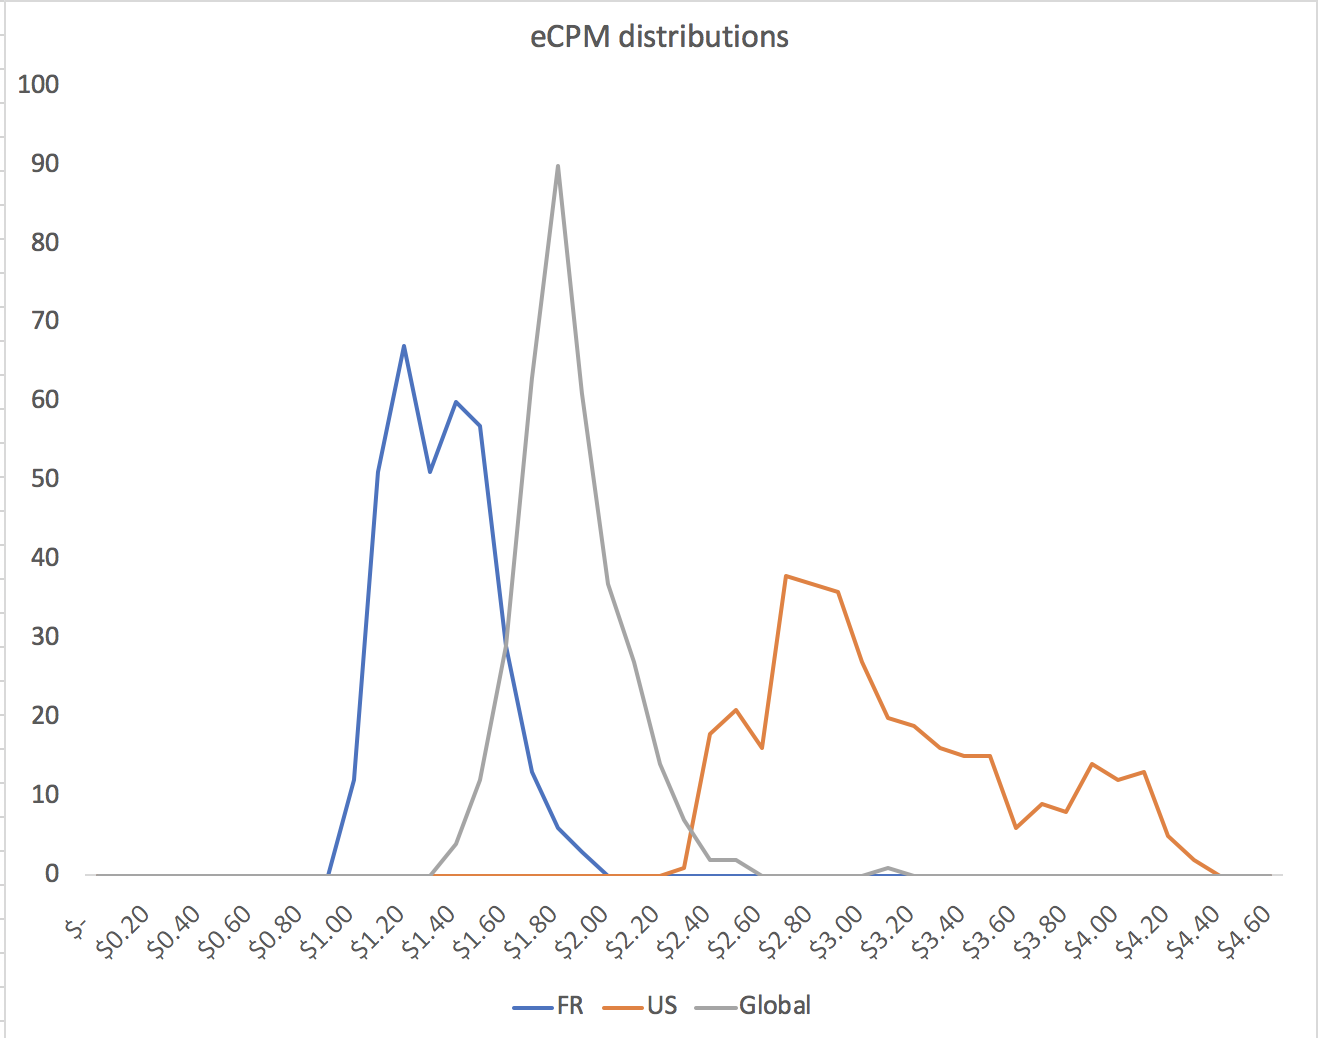
You do the math and you find the following distributions:

Looking through this lens we’re looking at 2 countries’ eCPM distributions and comparing it to the global distribution. US has a big spread (standard deviation $0.55) and FR has a mediocre spread (standard deviation $0.20).
Doing this brings a few things to light. A global distribution eCPM has an average higher than FR with the same standard deviation. US has a wider distribution (when compared to the global one) and a larger expected eCPM value.
The insight here might yield the following conclusions about eCPM levers depending on your situation:
- If in soft launch, launching in FR yields no upside to launching globally. This is actually an advantage. If you can make something work in FR, you can make it work globally. In a gaming business you could make this a strategy and kill the app if it doesn’t work in FR. Don’t waste money on something that doesn’t work.
- If you want to launch and start monetizing upside, FR is not the way to go, US is.
This can yield the following strategy: “Soft launch all apps in FR. If it does well, go global and especially in the US.”
This is how risk can be useful in making bets and strategic decisions. Eventually you want to tie the quantified risk (standard deviation) to monetization and upside in the contextual business setting.
Caveat to the above: this is only one of the levers in making revenue. Depending on the other levers, it could change the way you think about an overall strategy. For example, if you can’t acquire a lot of users who view your ads in the US, but you can in FR, then this would change the dynamics of scaling a revenue business based on ads.