Investment risk for a digital marketer (Part 2: LTV quality models)
Marketers invest capital to acquire users and, in limited budget scenarios, they need to make decisions about the quality of revenue acquired for the investments they make. This post won’t serve as a comprehensive formula for understanding revenue quality in all companies, but can serve as a starting point for developers looking for discipline in understanding risk.
The levers
The “risks” to LTV can be described when breaking down what drives LTV into four main components:
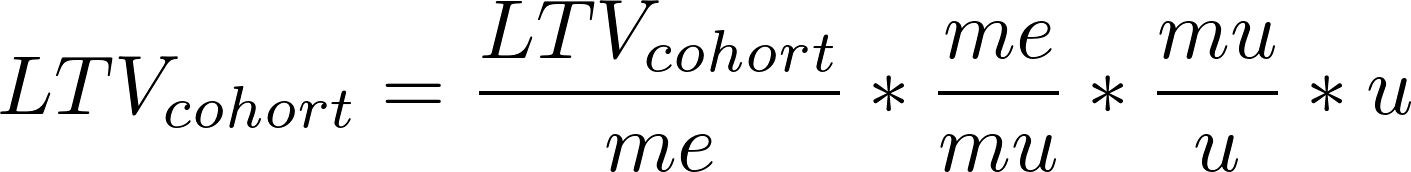
Where:
LTV = lifetime value for a cohort, the cumulative revenue generated for a specific cohort on an acquisition date period
me = monetization events, monetization events is anything that indicates a user action that resulted in generating direct revenue
mu = monetizing users, aka paying users - this is the number of users that contributed directly to generating revenue
u = users, number of users in the app (includes non monetizing users)
Breaking each of the fractions down will help a marketer understand how their LTV revenue can be at risk.
Why can’t we look at “risk” as the spread of daily LTVs? You could. You could pick 30-d LTV as the metric you’d like to analyze “risk” and follow the daily cohorts and standard deviations. This is a legitimate way to quantify the risk of your LTV. The weakness in this approach will be in the ability to understand and predict the internal business risks. For example, if you woke up one day to check your dashboards and saw that your LTV curves shifted and your standard deviations are larger, you would immediately want to know what drove that change. What part of the business caused the change? The framework above can give you that.
Monetization efficiency
The first lever describes how well a group of users will monetize given that they do monetize. This is simply taking the cohorted revenue (LTV) and dividing it by the number of monetization events that cohort generates.
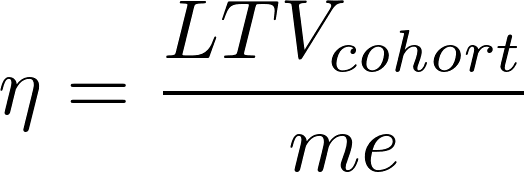
If you’re an app that monetizes showing ads, this would be similar to the eCPM that you derive to calculate how effective each impression (a monetization event) is for your app. A higher eCPM will yield more effective LTV and revenue.
Monetization frequency
Of the monetizing users, it’s important to understand how frequently they monetize through a moentization event. This is the second ratio:
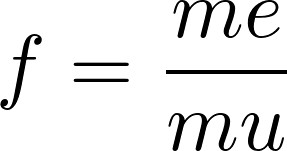
Goes without saying, but the more frequently a group of monetizing users monetize, the more predictable the revenue will be for that business. For 12 month subscription businesses the frequency of monetization events should be exactly 12 of a one year period.
Conversion rate
This is a commonly used metric for tracking the density of monetizing users out of a total population. Otherwise known as the paying user ratio:
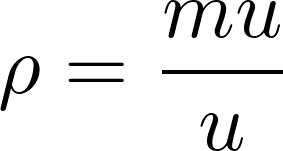
By measuring how many of the total users monetize, you can gauge how good your property is as monetizing its user base.
Generic to specific
Each of these ratios is generic enough to get applied to any business model. In fact, each of the ratios can get further divided into specific analytics for each type revenue stream. As an example let’s look at 2 specific types of business models:
- Ads based revenue
- In app purchase based
If a business had both business models, it can be simplified into the following equation:

If the business models are applied to all the users that are acquired in the same application it can be simplified to a generic case:

As it pertains to an ad revenue based model and the IAP models respectively you might get something like this:


You can see that breaking up revenue quality models by business model type yields some of the vernacular common for each business. No matter what the business, this model for revenue will always apply to break up how risky revenue can be.
Caveat: Sometimes these models don’t mutually exclude each other. In the example above, it could be the case that showing more ads to users will lower their willingness to purchase IAPs. This is a logical link developers need to be aware of and tested, but in a lot of situations models can directly effect each other.
Next steps
Now that we know the levers that can contribute to the quality of revenue, how do we best analyze each of them? What is a way to think about quantifying the risk into a single value?
In a future post, we will try to look at some data to show how risk can get more quantified.